Ephemeral Matters: Interview with Andrea Polli
June 10, 2021
With the world finally discussing solutions to avoid climate disaster, media artist Andrea Polli already has two decades of experience under her belt. Situated at the intersection of technology, science, and art her artistic practice explores the materialization of elusive atmospheres, transforming the ephemeral into media architectures. Andrea Polli discussed with Denisse Vega de Santiago.
To me data space is so fascinating because it can manifest itself in so many different ways, i.e. a sonification or a visualization of the same data, or a geospatial or haptic representation. Not only that, when the data is representing something in the real world, it can be so malleable.
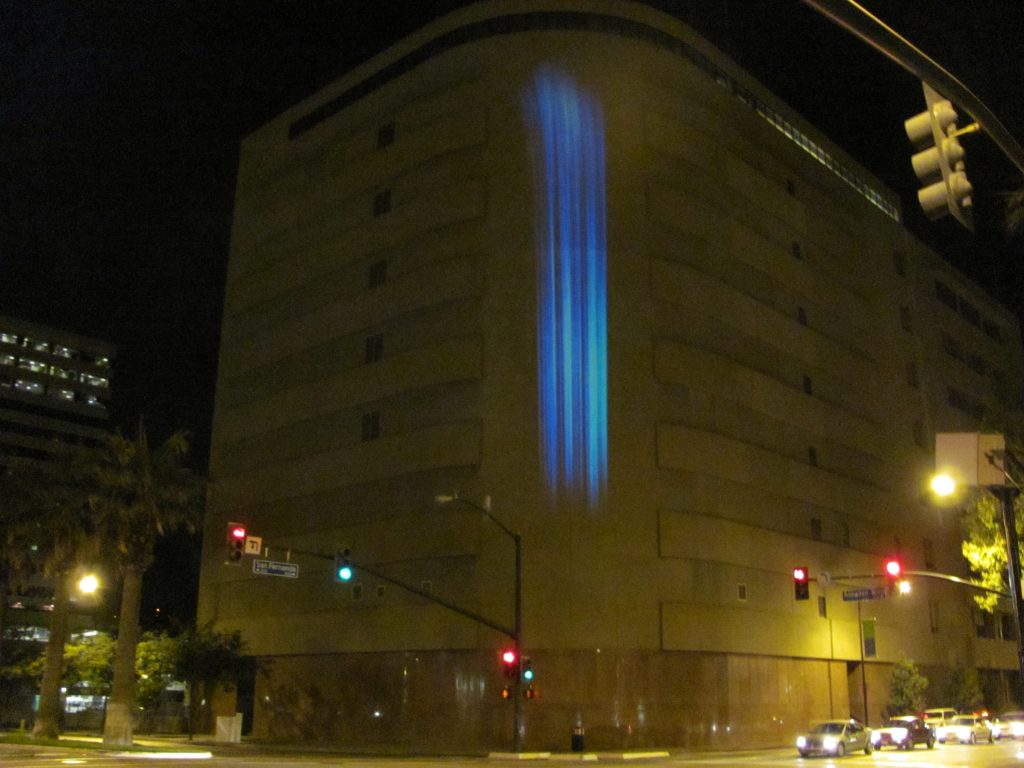
Perhaps we can start from Particle Falls, the large-scale light installation you developed for the city of San Jose California. In it, the real-time data of the city’s air pollution was projected onto a public wall, resembling a beautiful waterfall, or an intriguing fireplace at times. You have said elsewhere you are interested in “the materiality of wind and air”: could you tell us a bit more about this notion, and how it relates to the materialization of this project?
The city of San Jose was hosting a festival of electronic arts and also commissioning a public artwork to raise awareness of a new light rail extension in the city. I had been working on air-quality for several years, using mist systems to create clouds around cars for example, and working with air-quality hourly data from the EPA (Environmental Protection Agency) to animate digital images, mostly live transportation feeds for traffic that I then blurred electronically based on the particulate pollution.
The idea of making particulate pollution visible emerged out of a series of interviews I did with air-quality scientists where I learned that one of the more effective ways to convince people to advocate for cleaner air standards is visibility. For example, say you buy a home with a beautiful mountain view, but 100 days out of the year particulate pollution obscures that view, therefore, not only lowering your enjoyment of your home but also your property’s value. I thought that if people could see their air quality in places where the air quality isn’t so dramatically visible, it might have an impact, so the idea came from a real, material phenomenon.
San Jose wanted to activate a dark corner of the city with a tall windowless building that was rounded at the corner, and when I visited the site, I imagined it was a jungle and that is where the idea of the tall waterfall came from. I was fortunate to receive professional particulate pollution monitor as a donation from Met One, and I used that to detect the pollution on site every 15 seconds, which was essential for creating a feeling of interaction with the air.
I like this idea of the artist that makes something visible in a different way, and I think your practice highlights very well the possible collaborations between art and science. Apart from the material phenomena and its data visualization that science provides you, what other relationships or methods from science inform your artistic process?
I have been very aware of the increasing conflict between scientific ways of thinking and popular thinking in the US. The scientific way of thinking embraces discussion and disagreement in order to function and thrive, while the media in the US has promoted the idea of ‘both sides’, implying that any opinion is valid, or that truth may lie somewhere in the middle. That first became apparent to me when I started working with climate scientists and saw the media present healthy scientific debate to create public doubt in the sciences.
When I was in Antarctica in 2007, many of the scientists I interviewed talked about a “war on science”, pointing out that at that time publications emerging from research funded by the US government could not use the words ‘climate change.’ Because I am an artist, many of the scientists felt comfortable talking to me about their concerns, and they were happy that I could publish these concerns in my venues while they as scientists were very limited in what they could say publicly. So, I believe this is one important function of an artist, to say things that others may be prevented from saying for political or professional reasons.
Outside of this, I think there are methods that artists use that are similar to scientific methods. Many of us are experimental in how we work, but we often have more freedom than scientists in how we proceed with our experiments, and the freedom to pivot in a completely new direction that may or may not be justified by the results of our experiments. I think intuition plays a much larger role than people might think in the work of scientists, especially in the field, but the intuitive process is often central to the work of artists. Probably the most ‘scientific’ method I use that hasn’t already been mentioned is interviewing experts to gain information that may or may not lead to a project.
What are your thoughts about the specific contribution of the signs created by science-research based artists in the city, as opposed to those created by architects & urban planners?
That is an interesting question. I have noticed architects and urban planners taking up the task of information visualization with techniques like parametric architecture, and I have worked quite a bit with architects in producing public artworks. I would respond to your question with ‘it depends,’ because I think the practice of architecture has become so wide-ranging and the skills so diverse, it is certainly possible for an architect to work in collaboration with scientists to create meaningful visualizations. I guess if I had to make a distinction, I might say that it often seems to be the artist’s role to push the envelope and try new things, which might be unconventional to architects and developers. Something I have experienced in collaborations with scientists is that, as an artist, it has sometimes been my role to change the way the scientists experience their data. I think this can also be the role of an artist in collaboration with architects and planners, in other words, an artist – especially one working with the visualization of data integrated into the architecture – can help an architect or planner see their designs in a new way.
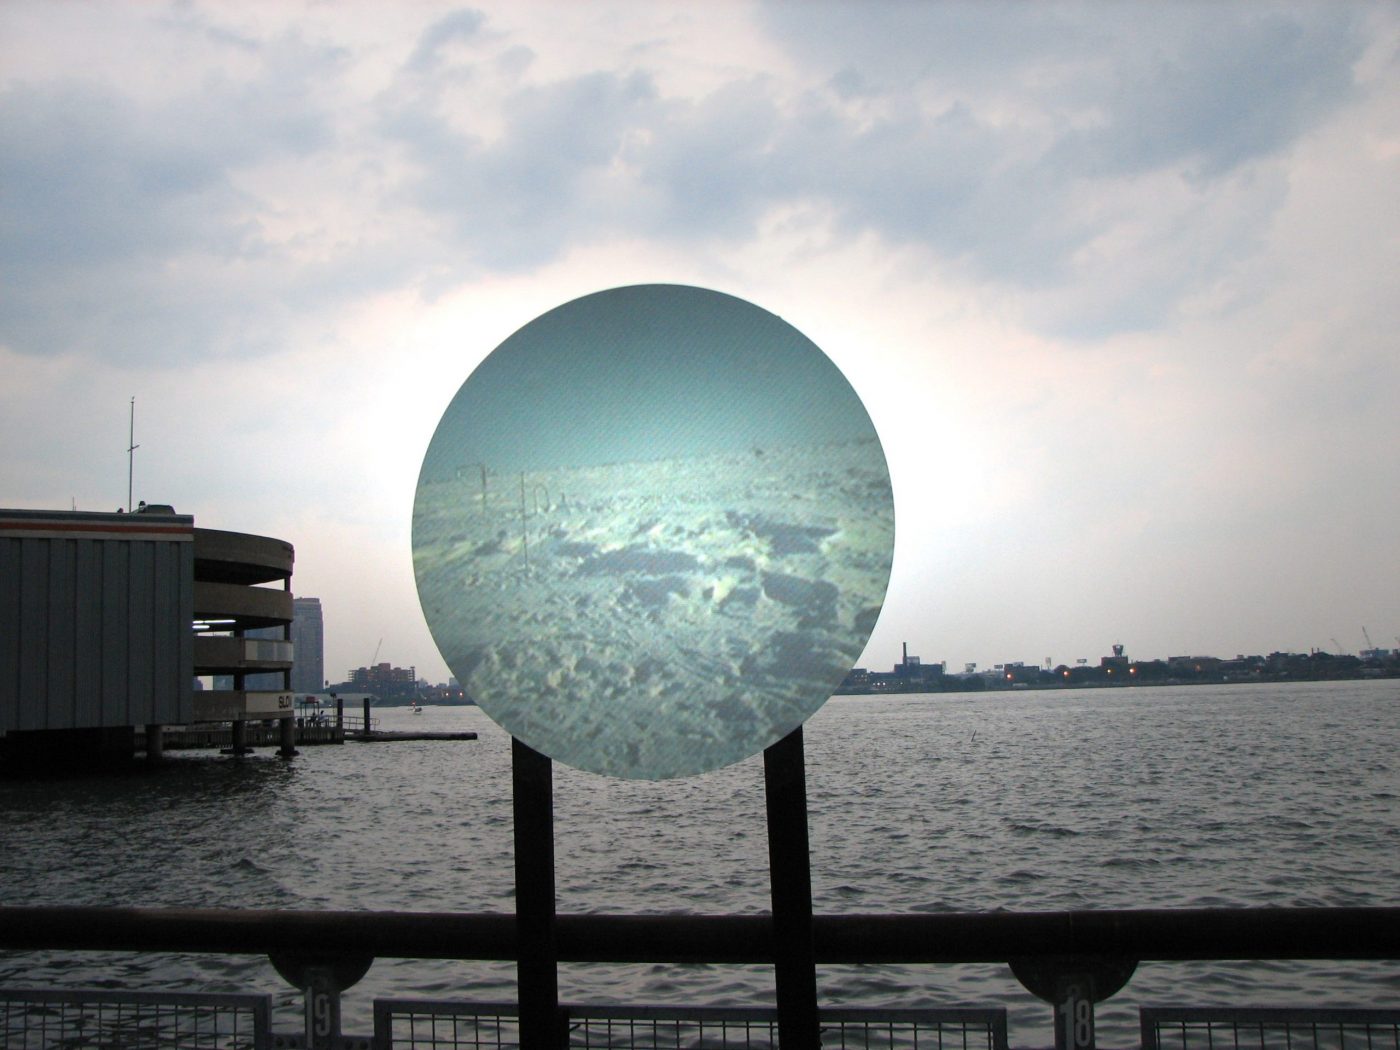
You are exactly right, now we are seeing the involvement of artists in collaboration with urban planners and architects in the fabric of urban infrastructures informed by data visualizations and that seems quite exciting. But it seems to me that your artistic work does not only visualize complex scientific data in a more creative way. There is something else that happens in your installations, something that is much more profound and harder to measure. I am thinking specifically of N-point (2007), in which you dealt with real time imaginary from the North Pole with sonification of real time weather data, which I found quite powerful, especially when it was placed in public space. It seems to me that the work does something else apart from offering a visualization of data in relation to climate: the work is an object in itself, which allows us to be in two different places at the same time, on Hudson River in NYC and in the Arctic. It seems to me that this fragmented contraposition of image-data introduces a more complex layer to our experience of the city and our perception places such as the North Pole, that perhaps allows us to understand something about climate, and our engagement with it by how we perceive it in the images you are producing? Does this reading of your work – an ‘experience of fragmented displacement’ which contributes to the media architecture fabric of cities – make sense to you? Or did I just go off on a completely different tangent…?
[laughs] No, the idea of displacement is very much present in a lot of my work, or more accurately, the idea of being in more than one place at the same time. These could be geographic places, as you observed in the N-point project but it could also be different kinds of spaces – like physical space or data space. It’s funny, my work has definitely been influenced by virtual space and its positive and negative effects on our lives, but I never expected the dramatic shift towards virtual experiences that happened this past year because of COVID.
One of my first major projects in the early 90s was a touring musical performance called ‘Intuitive Ocusonics’ that featured a software system I created to make music from real time eye movements. Part of the inspiration for making that system was an artist colleague who suffered a major accident and became paralyzed. I started to investigate ways to help her to be able to communicate better and learned about eye tracking. The other part of the inspiration was my frustration with the early videoconferencing systems that I was using for teaching. I thought that an eye tracking system could provide more information that could help people connect more effectively online. My colleague learned to walk and talk again thanks to intensive therapy, and I integrated the eye tracking work into music performances.
The experience of videoconferencing hasn’t changed that much since then: although speeds have increased and larger numbers of streams can be used more widely, videoconferencing is still a face on a screen and a [mediated] voice, with very little supplementary information. What changed is our expectations. I think this is because we can allow our imaginations to fill in the gaps in the technology in order to use it more effectively. While it has been so important during this pandemic, I can’t help but feel that an opportunity has been missed to find a way to more deeply connect with each other and our environment using data space.
To me data space is so fascinating because it can manifest itself in so many different ways, i.e. a sonification or a visualization of the same data, or a geospatial or haptic representation. Not only that, when the data is representing something in the real world, it can be so malleable. For example, data can represent a discrete moment in time, let’s say the current weather in a city, but implied in that data set is the weather from all the moments before that point in time in that city, or weather at that exact time in other cities, and predictions of possible futures, or infinities of alternate realities. The fact that the representation exists assumes possibilities of other representations so it’s like diving into other dimensions. Data space itself is often referred to as multi-dimensional depending on how many parameters are present. Thinking about the data in terms of multi-dimensionality can sometimes help people to understand the complexity of the data. In some ways, I would like the project I do to allow those experiencing the work to dive into that multi-dimensional data space and I hope that will allow them to see their present with new eyes.
As you know, for this edition of the media architecture biennale we are investigating the futures implied in any technological advancements from the perspective of interdisciplinary and future-oriented practices. In this regard, we are also interested in your practice in relation to innovative practices of education. As an art-science practitioner & educator, what transformations do you advocate for the field? What possibilities do you see for the construction of alternative futures and their impact on cities & environment?
I have been working very much on equity, diversity, and inclusion in art-science. Unfortunately, the field has historically been very homogenous in terms of race and ethnicity, and we need to be proactive in supporting and encouraging a greater diversity of practitioners. There have been several studies that have shown that more diverse teams produce more effective solutions more quickly, and the acceleration of climate change effects has made the problems more urgent than ever.
I am very glad you brought the issue of race and inclusivity, so present in societies right now. In the context of the pandemic, coronavirus has made the interconnectedness of the various crises facing the world today hyper-evident: biological, ecological, economical, societal. At the same time the role of science and data has been crucial to deal with these issues. How do these interconnected events influence your artistic practice, in relation to data visualization? For instance, data has shown that at least in the US, Black and Latino communities have been hit the hardest in terms of infections and death toll. Maybe this is a final speculative question to conclude our conversation, the need of making art-science a more inclusive discipline: do you have any thoughts, or could you speculate on a potential idea about a race project in relation to climate from a data visualization perspective?
AP: That question has so many implications! Where I live in New Mexico there are 19 different Pueblos, or Native American Tribes, with as many languages, and very different worldviews than those in Western thought. The way that environmental data is collected, analyzed, and understood needs to evolve based on more inclusive cultural practices. For example, there are stories from some of these tribes about the distant past that started to inform our understandings of paleoclimate. In another example, some tribes have initiatives to use environmental sensors to collect and analyze their own data, empowering their communities. I published a book called Hack the Grid a few years ago that gives examples of how low-cost sensors and microprocessors can be used by communities and encourage more of this. In my view, increasing access to low-cost sensors, microprocessors and control of data storage within communities, coupled with access to education on how to use the technologies effectively and creatively, is essential to empowering them, and to our global response to climate change. In my work with meteorologists and other atmospheric scientists, I learned that increasing the density of sensors can help to make predictive models more accurate, and that there is a large network of weather stations in the US operated by amateurs that feed into weather models. More of this kind of local monitoring connected to national and global models can increase understanding of the effects of climate change and mitigation.